|
|
Agnes
D. Garcia, B.S.* Allen
J. Catterton, B.S. ABSTRACT: 1,4-butanediol (BD), an analog and "pro-drug" of gamma-hydroxybutyric acid (GHB), is increasingly being added to so-called dietary, health, sleep aid, or sports (bodybuilding) supplements, and is also being sold on the Internet and on underground markets for purposes of illicit abuse. When so intended for human consumption, BD meets the definition of a controlled substance analog under the Controlled Substances Act, Title 21, and can be prosecuted as a Schedule I substance. A comprehensive analytical profile for BD is presented, including GC/MS, FTIR, NMR, GC/IRD, and GC/FID. Analytical parameters for the quantitative analysis of BD are also presented, along with linearity and reproducibility data. KEYWORDS: 1,4-Butanediol, gamma-Hydroxybutyric Acid, gamma-Butyrolactone, BD, 1,4-BD, GHB, GBL, Analogs, Pro-Drug Introduction The widespread, illicit abuse of gamma-hydroxybutyric acid (GHB) is due to its euphoric, sedative, hallucinogenic, and alleged steroidal effects (1). Recently, GHB abusers have been switching to related compounds in an attempt to circumvent the Federal controls on GHB (2,3,4,5,6). 1,4-Butanediol (BD) and gamma-butyrolactone (GBL) (Figure 1) are the two most commonly encountered such compounds, and are considered to be both analogs and "pro-drugs" of GHB, since their chemical structures are substantially similar to GHB and they are metabolized into GHB upon ingestion and therefore produce the same psychopharmacological effects as GHB (2,3,4,5,6). Figure
1: Diagram of Structures.
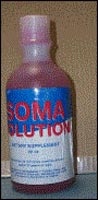
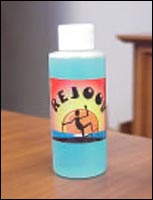
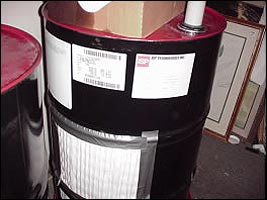
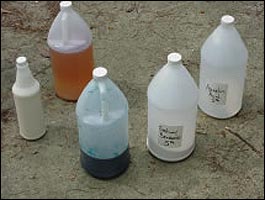
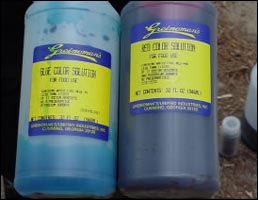
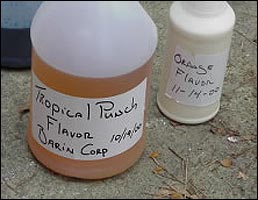
Abusers of BD indicate that its ingestion results in some unpleasant side effects, including a hangover (7). Therefore, some clandestine laboratories convert BD to GBL, which is the lactone of GHB and therefore a more direct pro-drug of GHB. Methods for conversion of BD to GBL have been published in various venues [Details and methodologies not provided, per Journal policy]. However, the most commonly seen clandestine laboratories working with BD are simple "re-packaging" operations. In these laboratories, clandestine chemists dilute industrial-grade BD with water and/or other components such as flavoring agents, coloring dyes, and/or sugars, then repackage the resulting mixtures in small bottles with homemade labels on them. Such laboratories usually consist of drums of BD, flavoring agents, coloring dyes, sugars, volume dispensing pumps, and various other chemicals (see Photos 3a - 3d, below). The forensic analysis of BD has been previously reported (2,4,8); however, these previous studies were published in law enforcement restricted venues. Herein is reported detailed procedures and techniques that can be utilized for the comprehensive analysis of BD.
Reagents 1,4-Butanediol standard and octane (C8H18, used as an internal standard) were obtained from Aldrich. Other solvents (such as high purity methanol and chloroform) were obtained from Baxter. GC/MS Gas chromatography/mass spectrometry analyses were performed on a Hewlett Packard (HP) 6890 GC interfaced with a Hewlett Packard 5973 Mass Selective Detector (MSD), using a scan acquisition from 35 to 500 amu. A crosslinked 5% phenyl methyl siloxane column (HP-5), with 0.25 mm internal diameter x 30 m and 0.25 µm film thickness, was utilized. The injection port temperature was 260°C and the detector and transfer line temperatures were 280°C. The GC oven temperature was held at 50°C initially for 2 minutes, then ramped at 35°C/min to 290°C, with a final hold of 4 minutes. FTIR/ATR A Nicolet Nexus 470 with a potassium bromide (KBr) beamsplitter and a deuterated triglycine sulfate (DTGS) KBr detector, equipped with a Durascope Dicomp ATR accessory with a 3-bounce diamond ATR element, was utilized for attenuated total reflectance IR analyses. The resolution was set at 4.000 cm-1, with 32 scans between 4000 cm-1 and 550 cm-1. The mirror velocity was 0.6329 cm per second. BD (neat) was prepared on a KBr pellet and analyzed using the same parameters, except that the wavenumbers were set between 4000 cm-1 and 400 cm-1. Aqueous samples were easily analyzed by allowing a portion of the sample to evaporate at low heat on the heating plate of the ATR instrument. However, many BD-containing "supplements" also contain color dyes, flavoring agents, and sugars. These added components form a residue with BD during evaporation, thereby making it difficult to obtain clean IR spectra. A chloroform extraction is recommended for such samples. GC/FTIRD Vapor phase infrared spectra were obtained with a HP 6890 GC/BioRad IRD II Infrared Detector using a HP 5% phenyl methyl siloxane, 25 m x 0.32 mm x 0.52 µm (HP-5) column. The temperature program was set at 50/C for 1.5 minutes, then ramped up at 35/C/min to 290/C , with a final hold of 3 minutes. Column flow was 1.5 mL per minute with an average velocity of 28 cm/sec. The inlet was set at a splitless mode with an initial temperature of 260/C. The purge gas was nitrogen at 50.0 mL per minute. NMR FT-NMR spectra were obtained using a Varian Gemini 300 nuclear magnetic resonance spectrometer, operating at 300 MHz for proton. A standard 1H-NMR was performed, with 64 transients. Deuterated water, deuterated methanol, or deuterated chloroform can be used as solvents for BD; however, only spectra in deuterated water and deuterated chloroform are presented in this study. Quantitation by GC/FID Serial dilutions of standard were prepared in methanol, ranging in concentration from 0.0869 mg/mL to 20.67 mg/mL. The internal standard solution was prepared by dissolving octane in methanol, for a final concentration of 2.00 mg/mL. For analysis, an aliquot of the standard solution was mixed with an equal amount of the internal standard solution. GC analyses were performed on a Hewlett Packard 6890 Gas Chromatograph with a flame ionization detector, using a 0.25 mm internal diameter x 30 m HP-5 column with a 0.25 µm film thickness. An isothermal method (90°C for 2.5 minutes) was used. One µL of the standard and each sample solution were injected using an autosampler. The injection port and detector temperatures were maintained at 260°C and 270°C, respectively. Results and Discussion GC/MS The mass spectrum of BD is shown in Figure 2 (below). Figures 3a-3g (below) show a suggested fragmentation scheme. The mass spectrum has a base peak at m/z 42 and the [M-1] (molecular weight minus a hydrogen) ion at m/z 89 (Figures 3a, 3b). The peak at m/z 57 results from a loss of 32 from the M-1 fragment via a 1,3 hydride shift to form (+OH=CH-CH=CH2) at m/z 57 (Figure 3c). The second most abundant fragment (at m/z 44) results from the cleaving of the BD molecule to form (.+OH-CH=CH2) (Figure 3a). The loss of a water molecule from BD, followed by H-rearrangement leads to the formation of a ring (Figure 3d). When the ring cleaves, radical and charge stabilization become important (9). Thus, a second H-rearrangement occurs to yield a stable product (Figure 3e). Furthermore, the intense peak at m/z 71 is a result of several possible fragments (Figure 3f). Other peaks at m/z 42 and m/z 43 are shown below (Figures 3a, 3g). Figure 2: The Mass Spectrum of BD Standard.
FTIR/ATR The FTIR/ATR spectrum of BD (Figure 4a, below) has significant bands at 2936 and 2867 cm-1. The 2936 cm-1 peak is due to the asymmetric stretching of the methylene groups, while the symmetric stretching of the methylene groups causes the weaker 2867 cm-1 peak. Wagging of the methylene groups causes a series of bands from 1380 to 1150 cm-1. The broad band at 3300 cm-1 is due to inter- and intramolecular hydrogen bonding. The most prominent peak is at 1048 cm-1 and is due to the two primary alcohol groups (10). When utilizing an ATR, depth of penetration in the sample can affect peak intensities. The depth of penetration of the infrared beam in the sample is a function of wavelength, i.e., the longer wavelengths will show more absorbance. This is a characteristic in ATR analyses versus analyses using the traditional KBr matrices. A sample of BD was analyzed as a neat liquid on a KBr pellet to show this difference (Figure 4b). Figure 4a: The FTIR/ATR Spectrum of BD Standard.
The vapor phase infrared spectrum of BD is considerably simplified (Figure 5). The primary bands at 2938, 2888, and 1043 cm-1 represent the same bands seen at approximately the same wavelengths in the FTIR/ATR spectrum. However, the -O-H stretch at 3300 cm-1 in the FTIR/ATR spectrum shifts to 3668 cm-1 in the vapor phase, suggesting little or no hydrogen bonding (10). Figure 5: The GC/FTIRD Spectra of BD Standard.
NMR The proton spectra in CDCl3 showed singlet peaks at 1.4 (C2/C3 methylenes), 3.4 (C1/C4 methylenes), and 4.7 (hydroxyl protons) ppm (Figure 6). When the sample was run in D2O, chemical shift increases of 0.2 ppm were observed for all peaks, i.e., singlets were found at 1.6, 3.6, and 4.8 ppm, respectively (Figure 7). Figure 6: The Proton NMR spectra of BD standard in CDCl3.
GC/FID Using the specified GC/FID parameters, BD had a retention time of 1.862 minutes, while octane (I.S.) had a retention time 1.457 minutes (see Figure 8). Area ratios of the standard/internal standard were plotted against the corresponding BD concentrations. Linear responses for BD were found to be from 0.87 mg/mL to 10.64 mg/mL (Figure 9). The correlation coefficient was 0.9997, indicating a highly linear relationship. Reproducibility for both area counts and retention times were below 2.3% RSD (Table 1). Samples of BD could contain GBL or GHB. GHB, however, converts to GBL in heated injection ports under standard GC operating conditions, so only a GBL peak would be observed for exhibits containing GBL and/or GHB. For this reason, GBL was added to a sample of BD (to ensure that they do not co-elute), and was found to have a retention time of 1.678 minutes. Figure 8: The GC/FID Chromatogram of BD Standard.
Table 1: Reproducibility Data of BD and Octane.
Conclusions A variety of techniques can be used for the analysis of BD, including GC/MS, FTIR, NMR, GC/IRD, and GC/FID. The more difficult BD samples to analyze are illicit dietary supplements and commercial solvents, due to the presence of additional components. In these instances, a chloroform extract is recommended. Acknowledgements The authors would like to thank Christine Sannerud (Deputy Chief, Drug and Chemical Evaluation Section, Drug Enforcement Administration (DEA)), for sharing her expertise in GHB and related samples. The authors would also like to acknowledge Senior Forensic Chemist Donald Cooper (DEA Special Testing and Research Laboratory, Dulles, VA) and Forensic Chemist Walter Rodriguez (DEA Southeast Laboratory, Miami, FL), for their time and expertise in helping interpret the mass spectrum of BD. Special thanks also goes to Task Force Officer Brian Ballard (Atlanta, GA) for supplying Rejoov and BD clandestine laboratory pictures and valuable information on Internet purchases. Gratitude also goes to Forensic Chemist Amy Bederka (County Bureau of Identification, Raleigh City, NC) for useful conversations and pictures regarding Rejoov samples. References
* * * * *
|